

Our Town: Why Owen Sound Stopped Growing While Surrounding Townships Boomed
In this latest column in his limited series 'Our Town,' David McLeish examines why Owen Sound's population flat-lined after 1991 while its townships boomed.

OUR TOWN | OPINION
Our Town is a limited series of columns by Owen Sound resident David McLeish. This column reflects the analysis and evidence-based opinions of the author and is part of an ongoing opinion series. It is not news reporting.
In my last Our Town column, we looked at Owen Sound’s average income, and how it’s measured. Today, we’re exploring the small city’s population trends and why it’s been outpaced by surrounding townships.
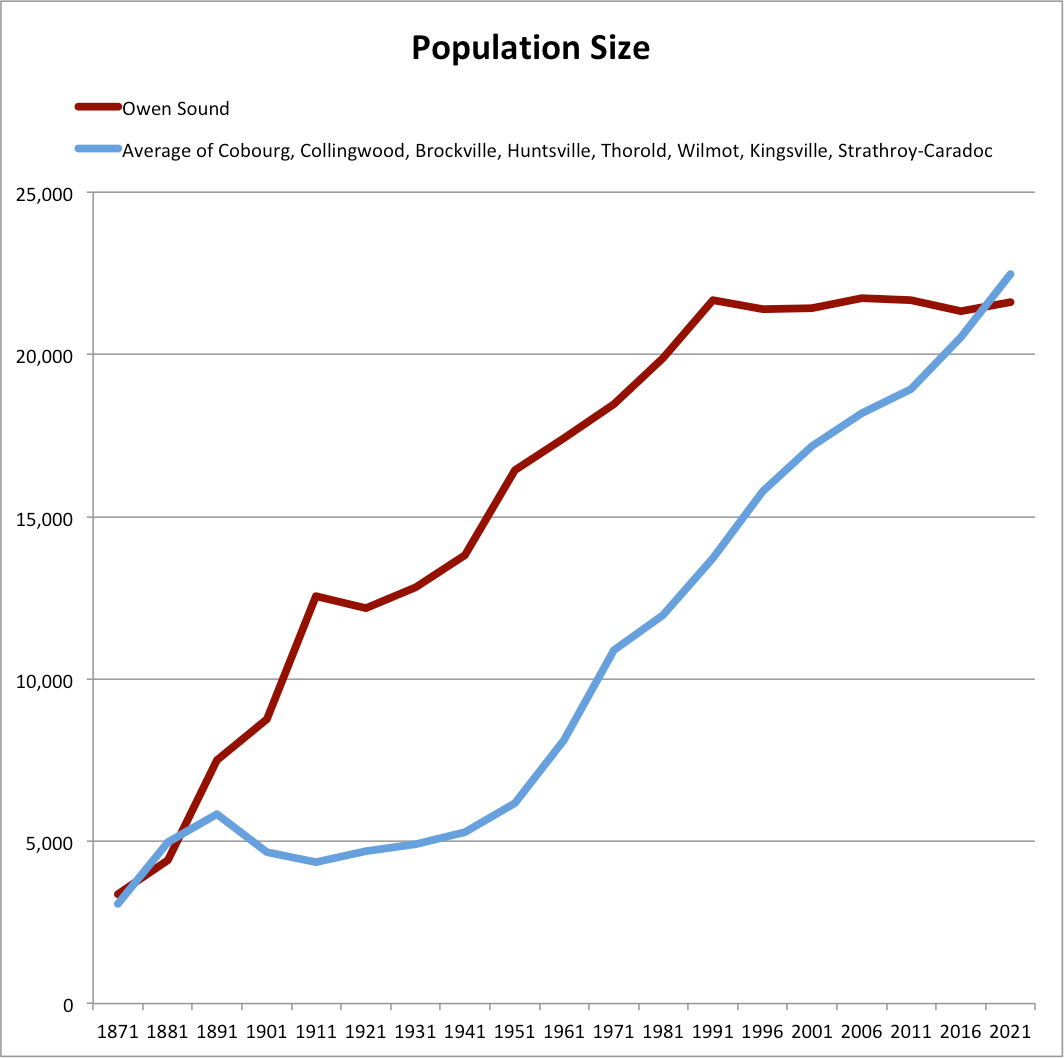
The population of the Town of Owen Sound was 3,369 in 1871, fourteen years after it was incorporated. The town and (later a City, incorporated on June 1, 1920), grew rapidly over the next 120 years.
Since 1991, however, the number of people living here has flat-lined. Over the past 30 years, the population has only deviated from the 30-year mean by 215 fewer to 56 more people.
Compared to nine other Ontario municipalities (Cobourg, Collingwood, Brockville, Huntsville, Thorold, Wilmot, Kingsville, and Strathroy-Caradoc), that all had populations less than 10,000 around the turn of the last century, Owen Sound grew much faster until the middle of the last century.
The City outpaced their average growth from 1891 to 1951 to the point that by 1951, Owen Sound was 2.7 times larger than the average of the other municipalities.
In other words, from a relatively similar starting size, Owen Sound grew to almost 3 times the average size of these other towns and cities.
Since then, however, Owen Sound’s relative growth has declined to the point that in the 2021 Census, for the first time since 1881, Owen Sound was smaller than the average of these communities.
This chart compares Owen Sound’s population growth to the average of the other 8 municipalities. As can be seen, while the City stopped growing in 1991, the other communities continued to grow.
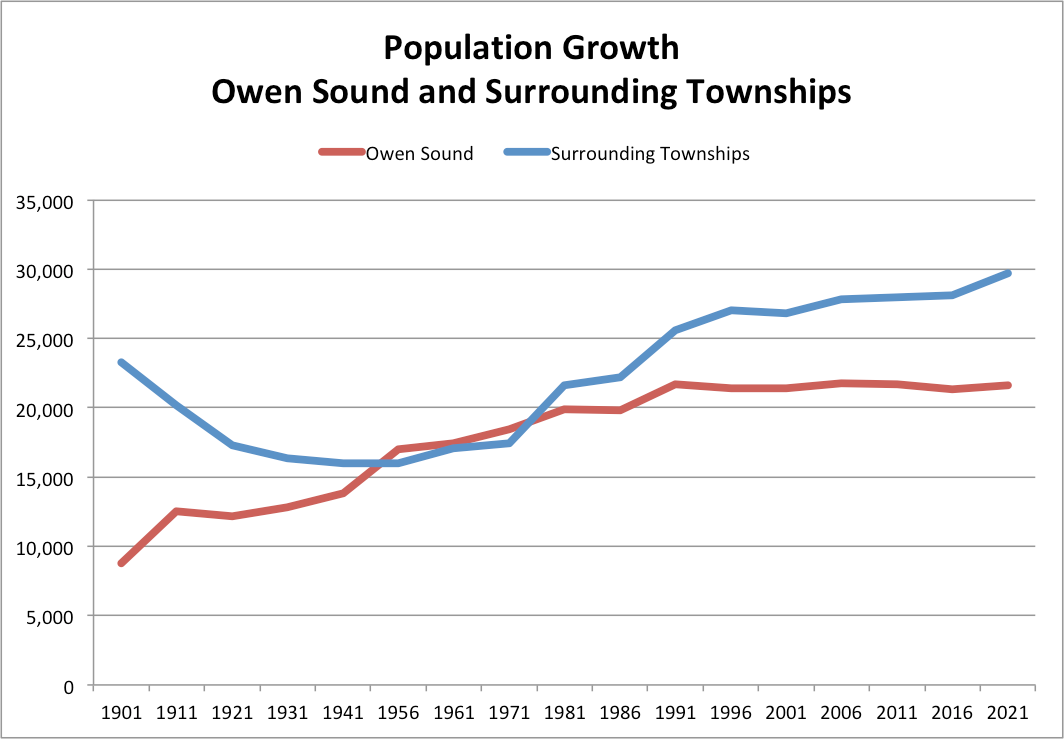
Moving closer to home, a comparison of population growth between Owen Sound and its surrounding townships (Georgian Bluffs, Chatsworth, and Meaford) also yields some interesting trends. Starting in 1901, Owen Sound had a population of 8,776 and the 3 Townships totaled 23,298.
As can be seen in the chart below, over the next 55 years, the population of the City grew and the Townships either became smaller or remained constant to the point that by 1956, the City was almost the same size as the three townships combined. After remaining almost identical in size for the next 20 years, things then changed very dramatically.
Commencing with the 1981 Census, the population of the three Townships increased substantially such that by 2021, their population was 8,053 greater than the City. Looked at another way, from 1971 to 2021 the population of the townships grew by 71% while the City’s population grew by only 17%. The reason for this lays not so much in a policy, but lack thereof.
A brief digression is warranted at this time. In the late 1990s, the Conservative government mandated Province wide amalgamations of municipalities. This reduced the number of municipalities from 815 to 447 by January 1, 2001.
Locally, the Townships of Derby, Keppel and Sarawak and the former Village of Shallow Lake were amalgamated to become the Township of Georgian Bluffs.
Similarly, the Townships of Holland and Sullivan and the village of Chatsworth were amalgamated to become the Township of Chatsworth; and the Townships of St. Vincent and Sydenham and the Town of Meaford were amalgamated into the Municipality of Meaford.
For the purposes of these analyses and to make interpretation of the data easier, the Census data for these towns and townships were combined to provide trend through time data as if the current three municipalities that now surround Owen Sound existed back to 1901.
Of the three (new) municipalities, the Township of Chatsworth’s population (i.e. Holland + Sullivan + the village of Chatsworth) is the only one that actually got smaller over time. It experienced a slow decline from 1901 to 1971, followed by a slow increase to 2021, ending with a population that was 121 fewer than it was in 1901.
In the amalgamated Township of Meaford, the majority of population growth took place in the previous Town of Meaford (i.e. the built up area). It grew by 2,765 between 1901 and 1996.
In contrast, Sydenham, and St. Vincent Townships declined by 199 and 498 respectively over the same period. At present, one or two more subdivisions are being considered in Meaford, suggesting it will grow again in the near future.
In Georgian Bluffs, the population decreased by about 2400 between 1901 and the 1960s/1970s.
The previous village of Shallow Lake declined to a low of 299 in the 1950s and 1960s, then rebounded to almost where it started in 1911, 505 people (4 fewer than it started with).
In Derby, Keppel, and Sarawak, there were some particularly notable changes. Between 1901 and 1991 Derby increased by 672, Keppel decreased by 548, and Sarawak increased by 1441.
Between 1971 and 1991, the population of Georgian Bluffs literally exploded, increasing by 4,419, or 83% over 1971.
Between 1971 and 2021, it grew by 5,781, a 109% increase.
By way of comparison, the population of Owen Sound increased by only 17% over the same period.
The reason for this discrepancy appears to be rooted in land use policies, or their lack thereof, particularly those related to lot creation.
Landowners have long been able sever off small or large parts of larger parcels (e.g. 90 acres) and sell those to others interested a hobby farm (45 acres) or a building lot (1 acre). This no doubt happened over the years as evidenced by the population increase in Sarawak.
It seems; however, that this practice escalated sharply in the 1980s. As noted by Dr. Wayne Caldwell and others in 2011: “…during the 1980’s and early 1990’s, a large number of rural non-farm lots were created in Grey County.”
In 2023, Caldwell and Dodds-Weir from the University of Guelph documented 7,453 severance applications in Grey County between 1979 and 1991, 91% of which occurred after 1982.
To be clear, there was nothing illegal about these severances; they were consistent with planning rules in place at the time. The number of severances in Grey County was; however, so large relative to the rest of the province, that the Ontario Ministry of Municipal Affairs (MMA) conducted an inquiry.
Importantly, Caldwell and Dodds-Weir noted that the County Planning Approvals Committee approved “over 70% of those applications to which the Grey County Planning Department had objected.” In other words, a County appointed Committee disregarded the recommendations of County staff.
This practice was halted when the MMA stepped in, eventually resulting in a new Grey County Official Plan (OP) in 1997. There was no shortage of opposition to the limitations placed on lot creation, but attitudes changed and they remain in place today.
The primary reasons for MMA’s concerns were related to the need to protect prime agricultural land from fragmentation, control urban sprawl, and manage development.
The government’s aim was to ensure the long-term viability of the agricultural sector, minimize conflicts between farming and non-farm residents, and preserve a continuous, productive land base.
Another concern related to the attendant creation of thousands of rural septic systems, which had the potential to contaminate ground water.
The severances noted above were followed by the construction of large modern houses that offered a rural lifestyle within a 10-20 minute drive of Owen Sound’s downtown. From 1981 to 2021 a total of 6,951 new dwellings were built in the townships.
It should be noted that prior to municipal amalgamation in the 1990s, 50% of the dwellings in Meaford Township were in the town of Meaford (i.e. the built up area). Assuming that this proportion has remained constant, that would mean there were an additional 5,585 dwellings built in the rural areas of the 3 townships.
The chart below compares the number of dwellings in Owen Sound to the number on the surrounding townships over the past 40 years.
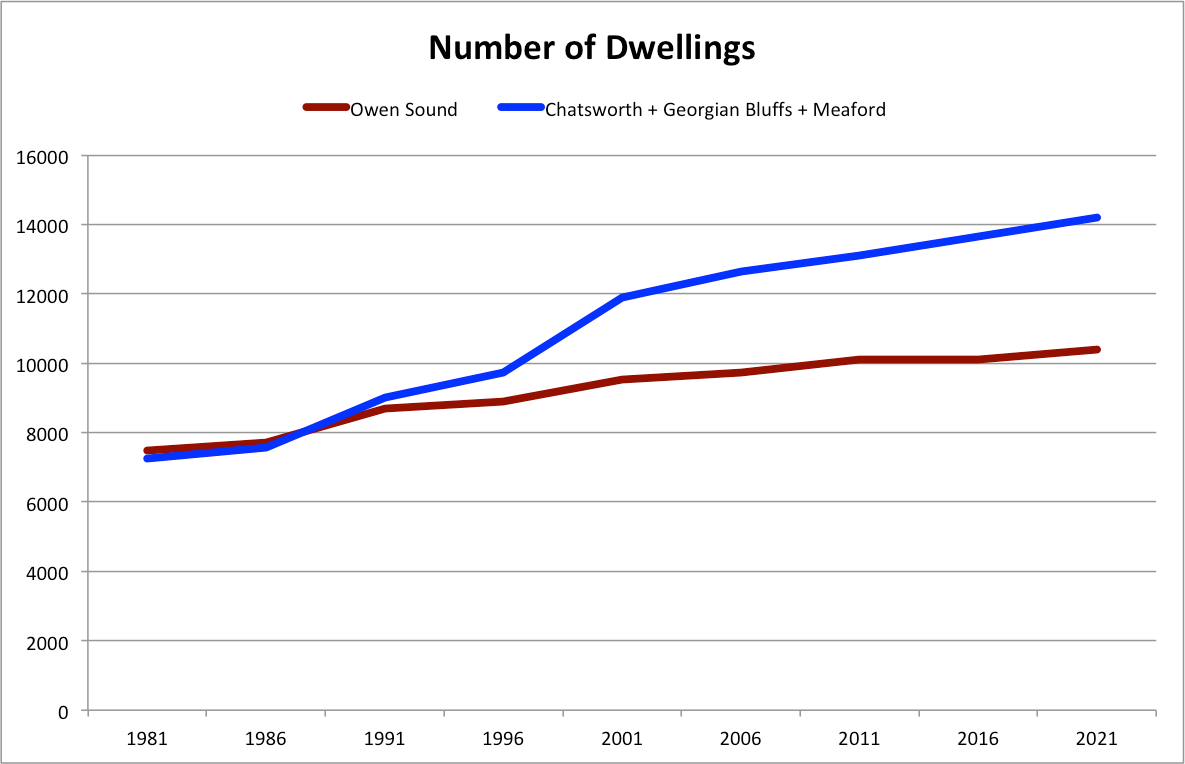
As can be seen, in 1981 there were 235 more dwellings in the City than all 3 townships combined. By 1986, that difference had fallen to 125, and by 1991, when houses began to be erected on the newly created lots, there were 300 more dwellings in the townships.
As more dwellings were erected on the newly created lots, the number of dwellings in the townships grew and grew to the point that by 2021 there were 3,785 more dwellings in the townships.
Again, as noted above, subtracting the 50% of dwellings in the actual village of Meaford (i.e. the built up area), there were 2,419 more dwellings in the rural areas of the 3 townships that in the City by 2021.
The next chart illustrates the shift in the balance between the number of dwellings in the City and in the surrounding townships. Each bar represents the number of dwellings in Owen Sound minus the number of dwellings in the surrounding townships per year.
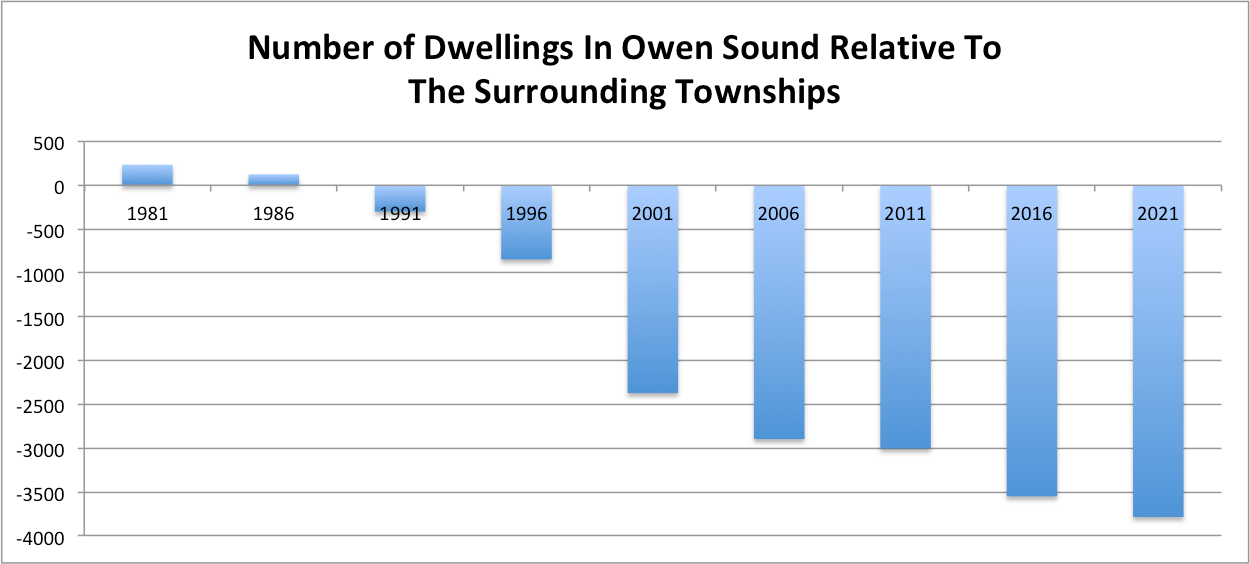
In 1981, there were 285 more dwellings in the City than the surrounding townships. By 1986 than number had fallen to 125, and by 2021 there 3,785 more dwellings in the townships.
This rural development precipitated a cascade of effects.
While data pertaining to the number of students who travel by bus is not available, the fact that “walk distances” are now 1.6 km suggests that there has been an increase in both the number of students needing to take a bus to school and the distances travelled.
Furthermore, the distribution of income has been affected.
The chart below illustrates the median household income (before taxes is used here because after-tax data is not available as far back as 1981) in Owen Sound relative to the surrounding townships from 1981 to 2021.
As can be seen, from 1981 to the early 1990s, the median household incomes were relatively similar. After 1991, however, the gap increased to the point that by 2021 the median household incomes in Meaford, Chatsworth, and Georgian Bluffs were $16,300, $17,800, and $30,800 more than in the City, respectively.
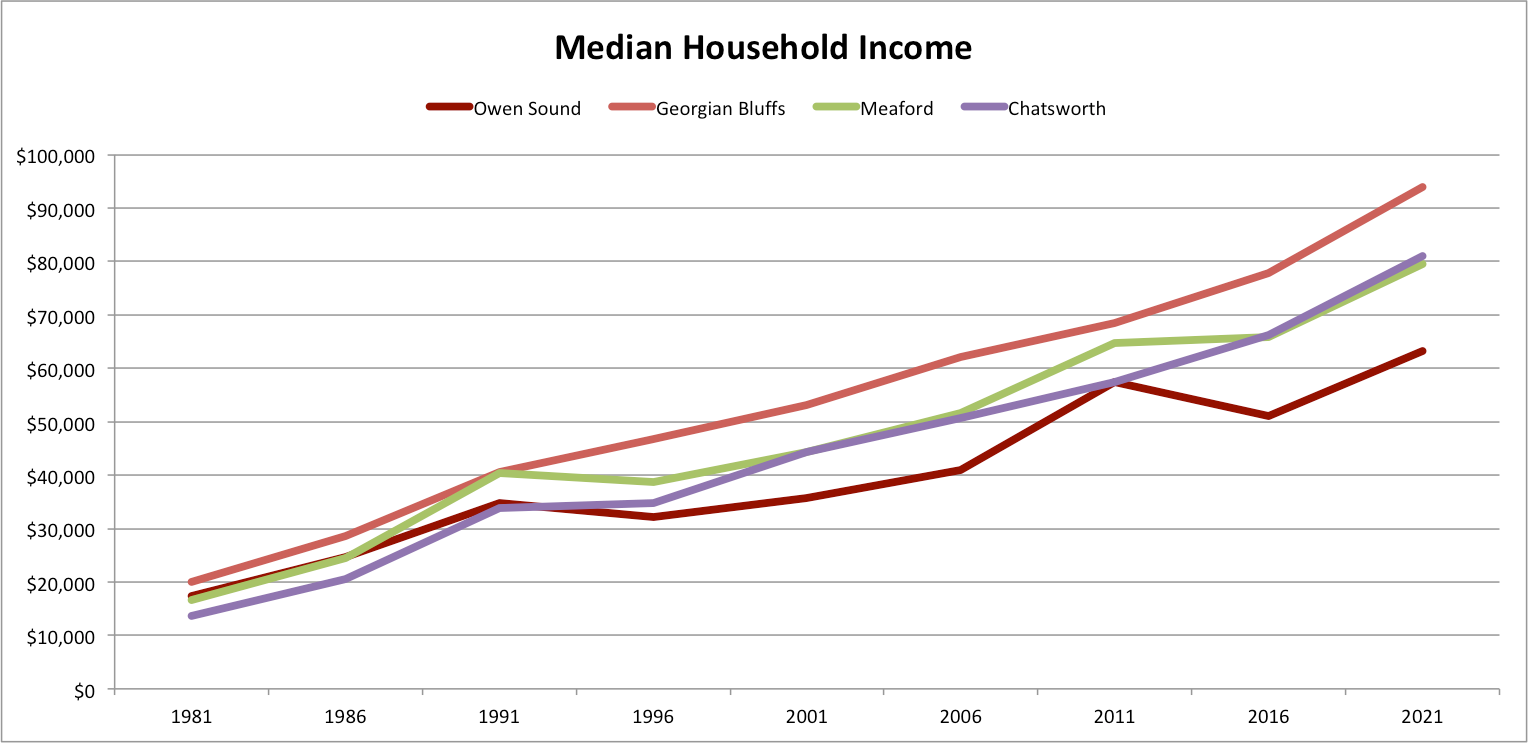
This suggests that thousands of middle to upper income earners opted for a rural lifestyle as opposed to an urban one. Looked at another way, those who are unable to afford one or two vehicles are excluded from this rural lifestyle.
As the chart illustrates, the median household income in Owen Sound has become progressively smaller relative to the surrounding townships since 1991. For example, the gap in median household incomes between Owen Sound and Georgian Bluffs increased from $14,689 in 1996 to $30,800 in 2021.
These observations are supported by data related to commuting. In this April 2022 article in The Hub, David Clark noted that, “Owen Sound receives 51% of its workers from other communities, and they come from Georgian Bluffs, Meaford, Chatsworth, South Bruce Peninsula, Arran-Elderslie, and Saugeen Shores, accounting for about 85% of the workers commuting to Owen Sound.” This was based on Statistics Canada data.
In addition, a personal survey of three offices in the City, with a combined workforce of 512 employees, revealed that 63% commute into the City to work.
It has often been pointed out that in addition to a different lifestyle, the surrounding townships also offer lower taxes. In 2024, the property tax on a detached bungalow in Georgian Bluffs, Meaford, and Chatsworth were 55%, 34% and 18% less than the tax on a similar dwelling in Owen Sound.
Similarly, the property tax on a 2-story house in Georgian Bluffs, Meaford, and Chatsworth were 43%, 19%, and 23% less than in the City.
In addition, most of these rural lots are on private wells, meaning they save about $1,500/year on water consumption, water service charges, and waste water charges.
Combined, a resident of these townships saves between $2,305 and $4,305 annually in taxes and utility costs.
While City dwellers often lament the higher costs in Owen Sound, it should be noted that the rural lifestyle comes with other costs and risks.
From the perspective of a cost benefit type analysis it should be noted that those living in the surrounding rural areas need at least two vehicles. Having raised two children in Georgian Bluffs, I speak from experience. With two people working, two children attending different activities, travel, and different schedules two vehicles are a necessity.
Also, once the children reach driving age, they often “need” a vehicle. The CAA Driving Costs Calculator puts the annual cost to operate an SUV at $2,767.95 and a hybrid passenger car at $4,699.92, including depreciation. That just about takes away any savings one might envision.
If you are a couple with no children a small benefit might realized, but there’s more.
One of the issues raised when the large number of severances was discovered related to the increase in private wells and septic systems.
Unlike Municipal water systems, such as Owen Sound’s, which are strictly regulated under the Safe Drinking Water Act, 2002, and overseen by the Ministry of the Environment, Conservation and Parks, private wells are entirely your responsibility. Any and all monitoring and maintenance are your obligation.
In the City, regulations require mandatory licensing of operators, municipal drinking water licensing, approved quality management systems, and stringent testing standards to ensure safety, largely stemming from the Walkerton Inquiry. That’s why the City recently issued a Precautionary Boil Water Advisory.
Private well-based systems are not regulated. The property owner is responsible for testing their own water, managing their own drainfields/tile beds, and addressing issues as they arise.
Depending upon the surrounding geology and development this can pose a range of challenges. For instance, back in 1996 the Canadian Environmental Law Association reported that:
“Dominated by Karst topography, Keppel Township has allowed scattered rural severances to such an extent that a serious groundwater contamination problem now exists.
Five years ago, scientists from the Ministry of the Environment recommended against the policy of allowing so many rural severances because of the vulnerability of the underlying topography to groundwater contamination.”
Yet, despite recommendations by the Province and Grey Bruce Public Health that owners of private wells test for bacteria at least three times a year (especially in spring/after heavy rain), the Ontario Auditor General reported in 2025 “less than one-third of Ontarians who rely on private wells tested their water within the last 12 months.”
While not a quantifiable monetary cost, rural well owners must manage the risk to their family’s health of a contaminated well as well as the required actions should contamination be detected. This in turn leads to options such as installing and maintaining things like UV filters, which address some issues, but not others.
Readers are reminded that Public Health Ontario and Grey Bruce Public Health offer free testing for E. coli and total coliforms. Surface water infiltration is the most common cause of contamination, making regular maintenance and testing vital.
Finally, the construction of most of these 5,585 dwellings would not be permitted today.
Grey County’s Official Plan states that development is restricted to:
“Primary Settlement Areas – larger settlements with full municipal servicing, and a wide range of uses, services, and amenities which are intended to be the primary target for residential and non-residential growth”
The only Primary Settlement Areas in this part of the county are Owen Sound and Georgian Villas/Cobble Beach. Despite this prohibition, the legacy of these past severances affects Owen Sound to this day.
If, and this is a big if, those 5,585 dwellings had been built in the City, as would be required today by the Grey County Official Plan, the City would collect about $31,087,227 more in taxes each year.
Even if only half of those dwellings had been built in the City, this would amount to $15,543,613 more in property taxes annually.
Demographics - Predicted Population
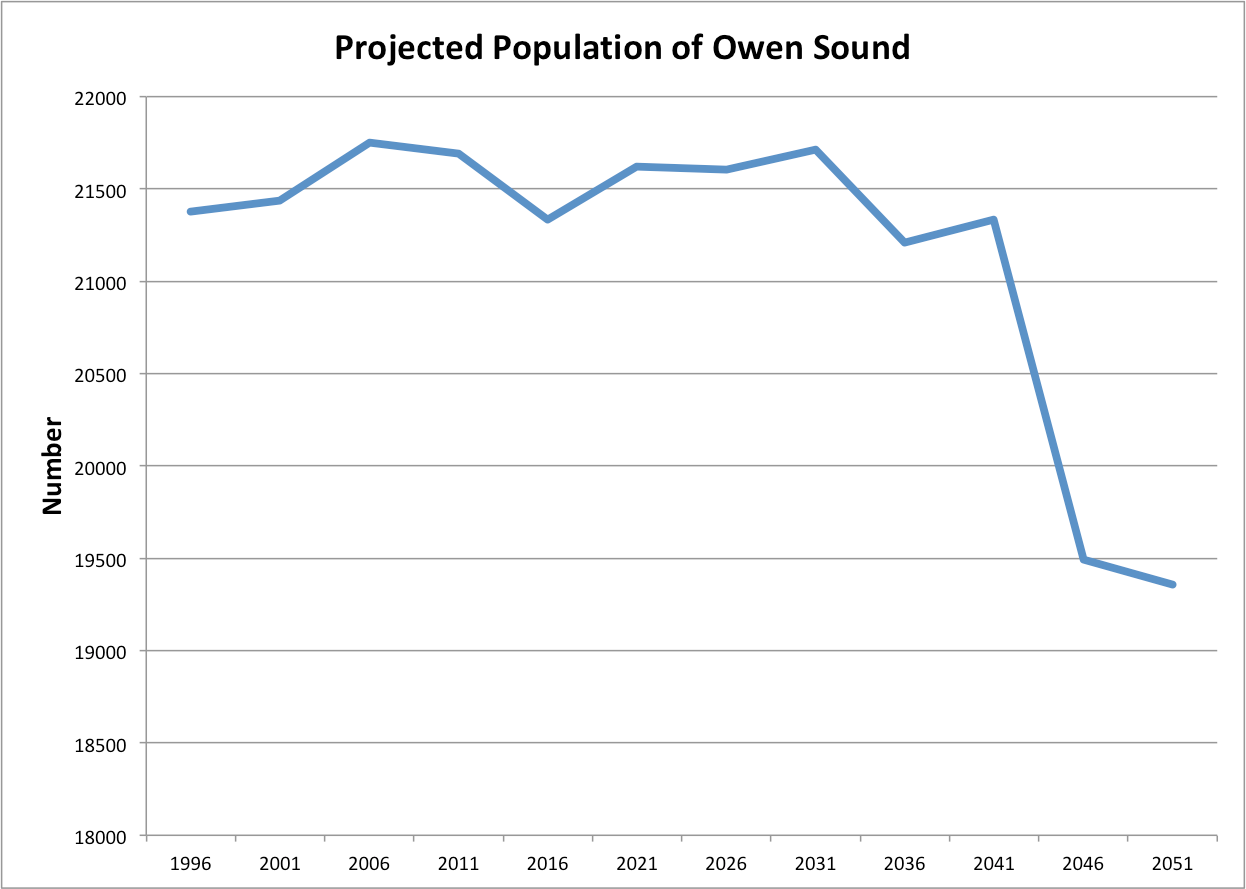
A very rudimentary age structured population model was developed to assess whether Owen Sound’s population will continue to stay the same, whether it will increase, or whether it will decrease. It forecasts what the City’s population will look like as we move into the future.
In keeping with the City’s Vision 2050, I ran the model to 2051. Obviously, one has to make a number of assumptions when creating a model, such as:
recruitment will continue as it has in the past (this is supported by the school enrolment data);
the changes documented in previous Censuses will persist (this is supported by data from 1996 to 2021 Censuses); and
mortality after 80 years remains constant (again, supported by data from 1996 to 2021)
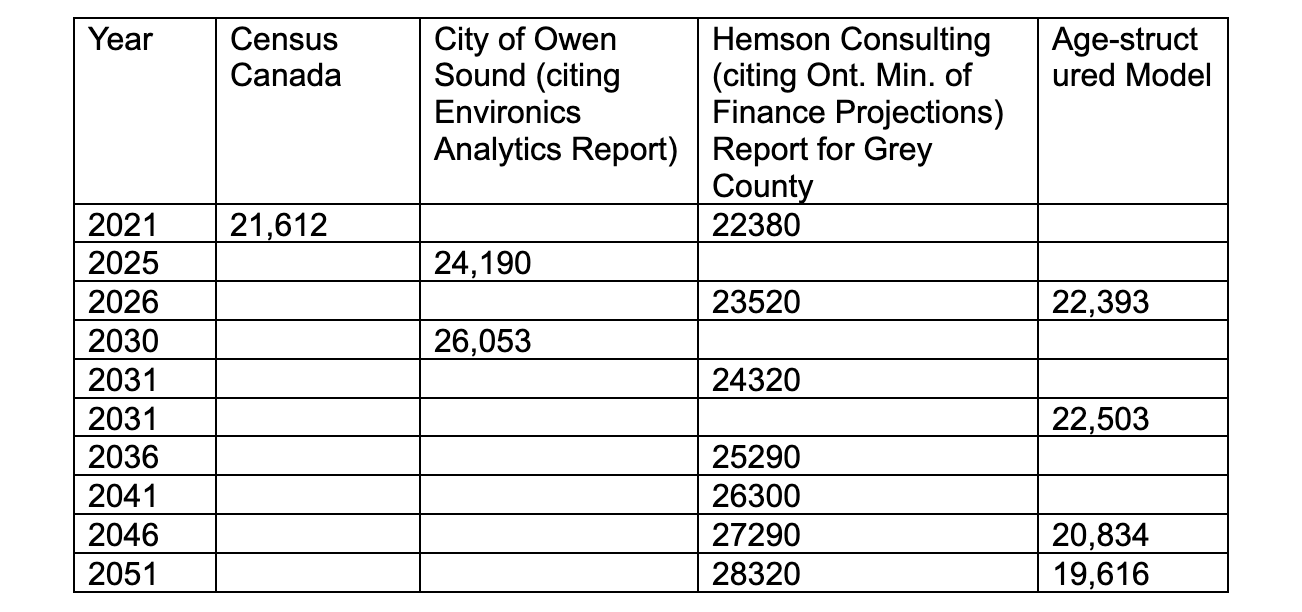
This model projects that the population of Owen Sound will remain relatively similar in size through 2026 and 2031, after which it will decline slightly until 2041 and then, as the Baby Boomers “shuffle off this mortal coil,” it drops by almost 2,000 to 19,538 by 2051.
Unless something major happens (e.g. large increase in school enrolment, arrival of a large employer precipitating immigration), to turn this around, this scenario seems likely.
Grey County has also estimated the future size of the City in their Official Plan. The table below compares Owen Sound’s 2021 population from Census Canada to projections from various sources including the model described above.
Time will tell which projection is the closest.
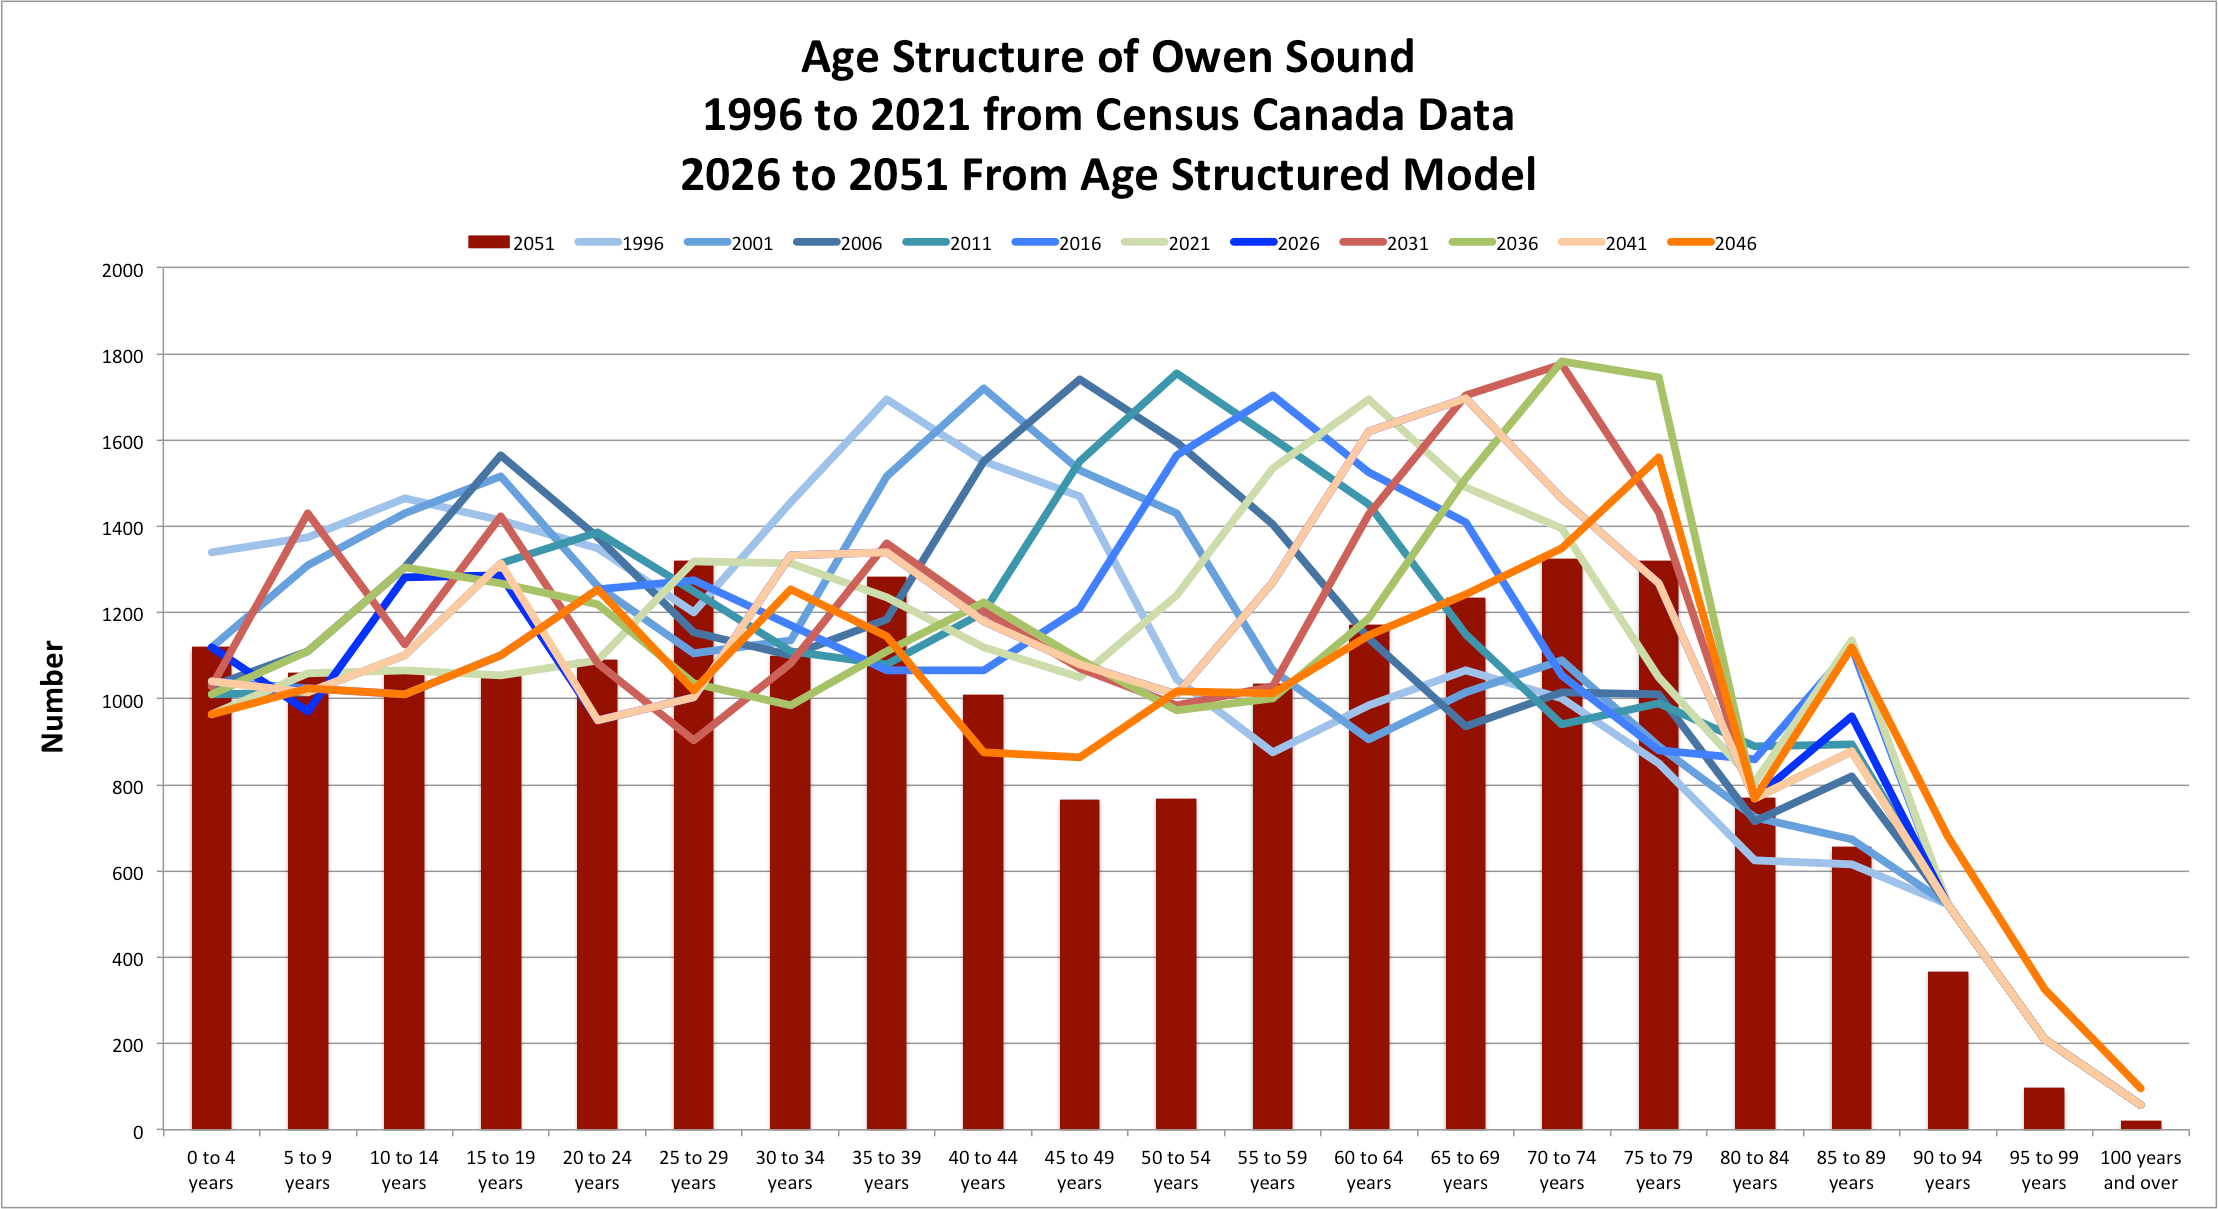
The following plot, which is admittedly very busy, uses Census Canada data to illustrate the actual age structure of Owen Sound from 1996 to 2021 in 5-year increments. The age-structured model is then used to predict the population from 2026 to 2051.
Lines were used for every year except 2051, which is in bars to clearly illustrate what the model predicts the age structure of the population will look like then.
The humps representing the Baby Boomers move like a wave through the years, coming into shore where they inevitably leave us.
In August 2022 (Owen Sound Hub - “Has Owen Sound “turned the corner” in its population growth?”), Mr. Clark challenged a quote attributed to the Mayor: “Following ten years of decline, the data shows we have turned the corner with an increase in the past five years... the City is trending in the right direction.”
His response bears repeating as it appears to have not been heeded. Clark noted that the Mayor’s comment:
“…discloses a common error made by many people who do not (truly) understand statistics, the meaning of ‘trends’, and limitations of using short time frames.”
As in 2019, Mr. Clark suggested “that Owen Sound has not ‘turned the corner’ on positive population growth, at least not that one can confidently forecast based on a single event. It is not responsible to predict such an event given such a short five-year time-frame and doing so is a mockery of good statistical analysis and research standards. I guess it is good politics, though.”
Stay tuned for the next in this limited series, where we take a deeper look at crime statistics impacting the City, what they show — and what they don’t.
Thank you to sponsors of The Owen Sound Current Writers’ Fund, who make these community contributions possible. Contributions from the community do not necessarily reflect the opinions or beliefs of The Owen Sound Current and its editor or publisher.
See more in this series:
