Winter of Discontent: Why This Was a Bad One, And How the City Responded
Owen Sound residents saw major winter damage. David McLeish takes a look at climate factors, snowfall trends, and the city’s response to the extreme weather.
COMMUNITY CONTRIBUTION
by David McLeish
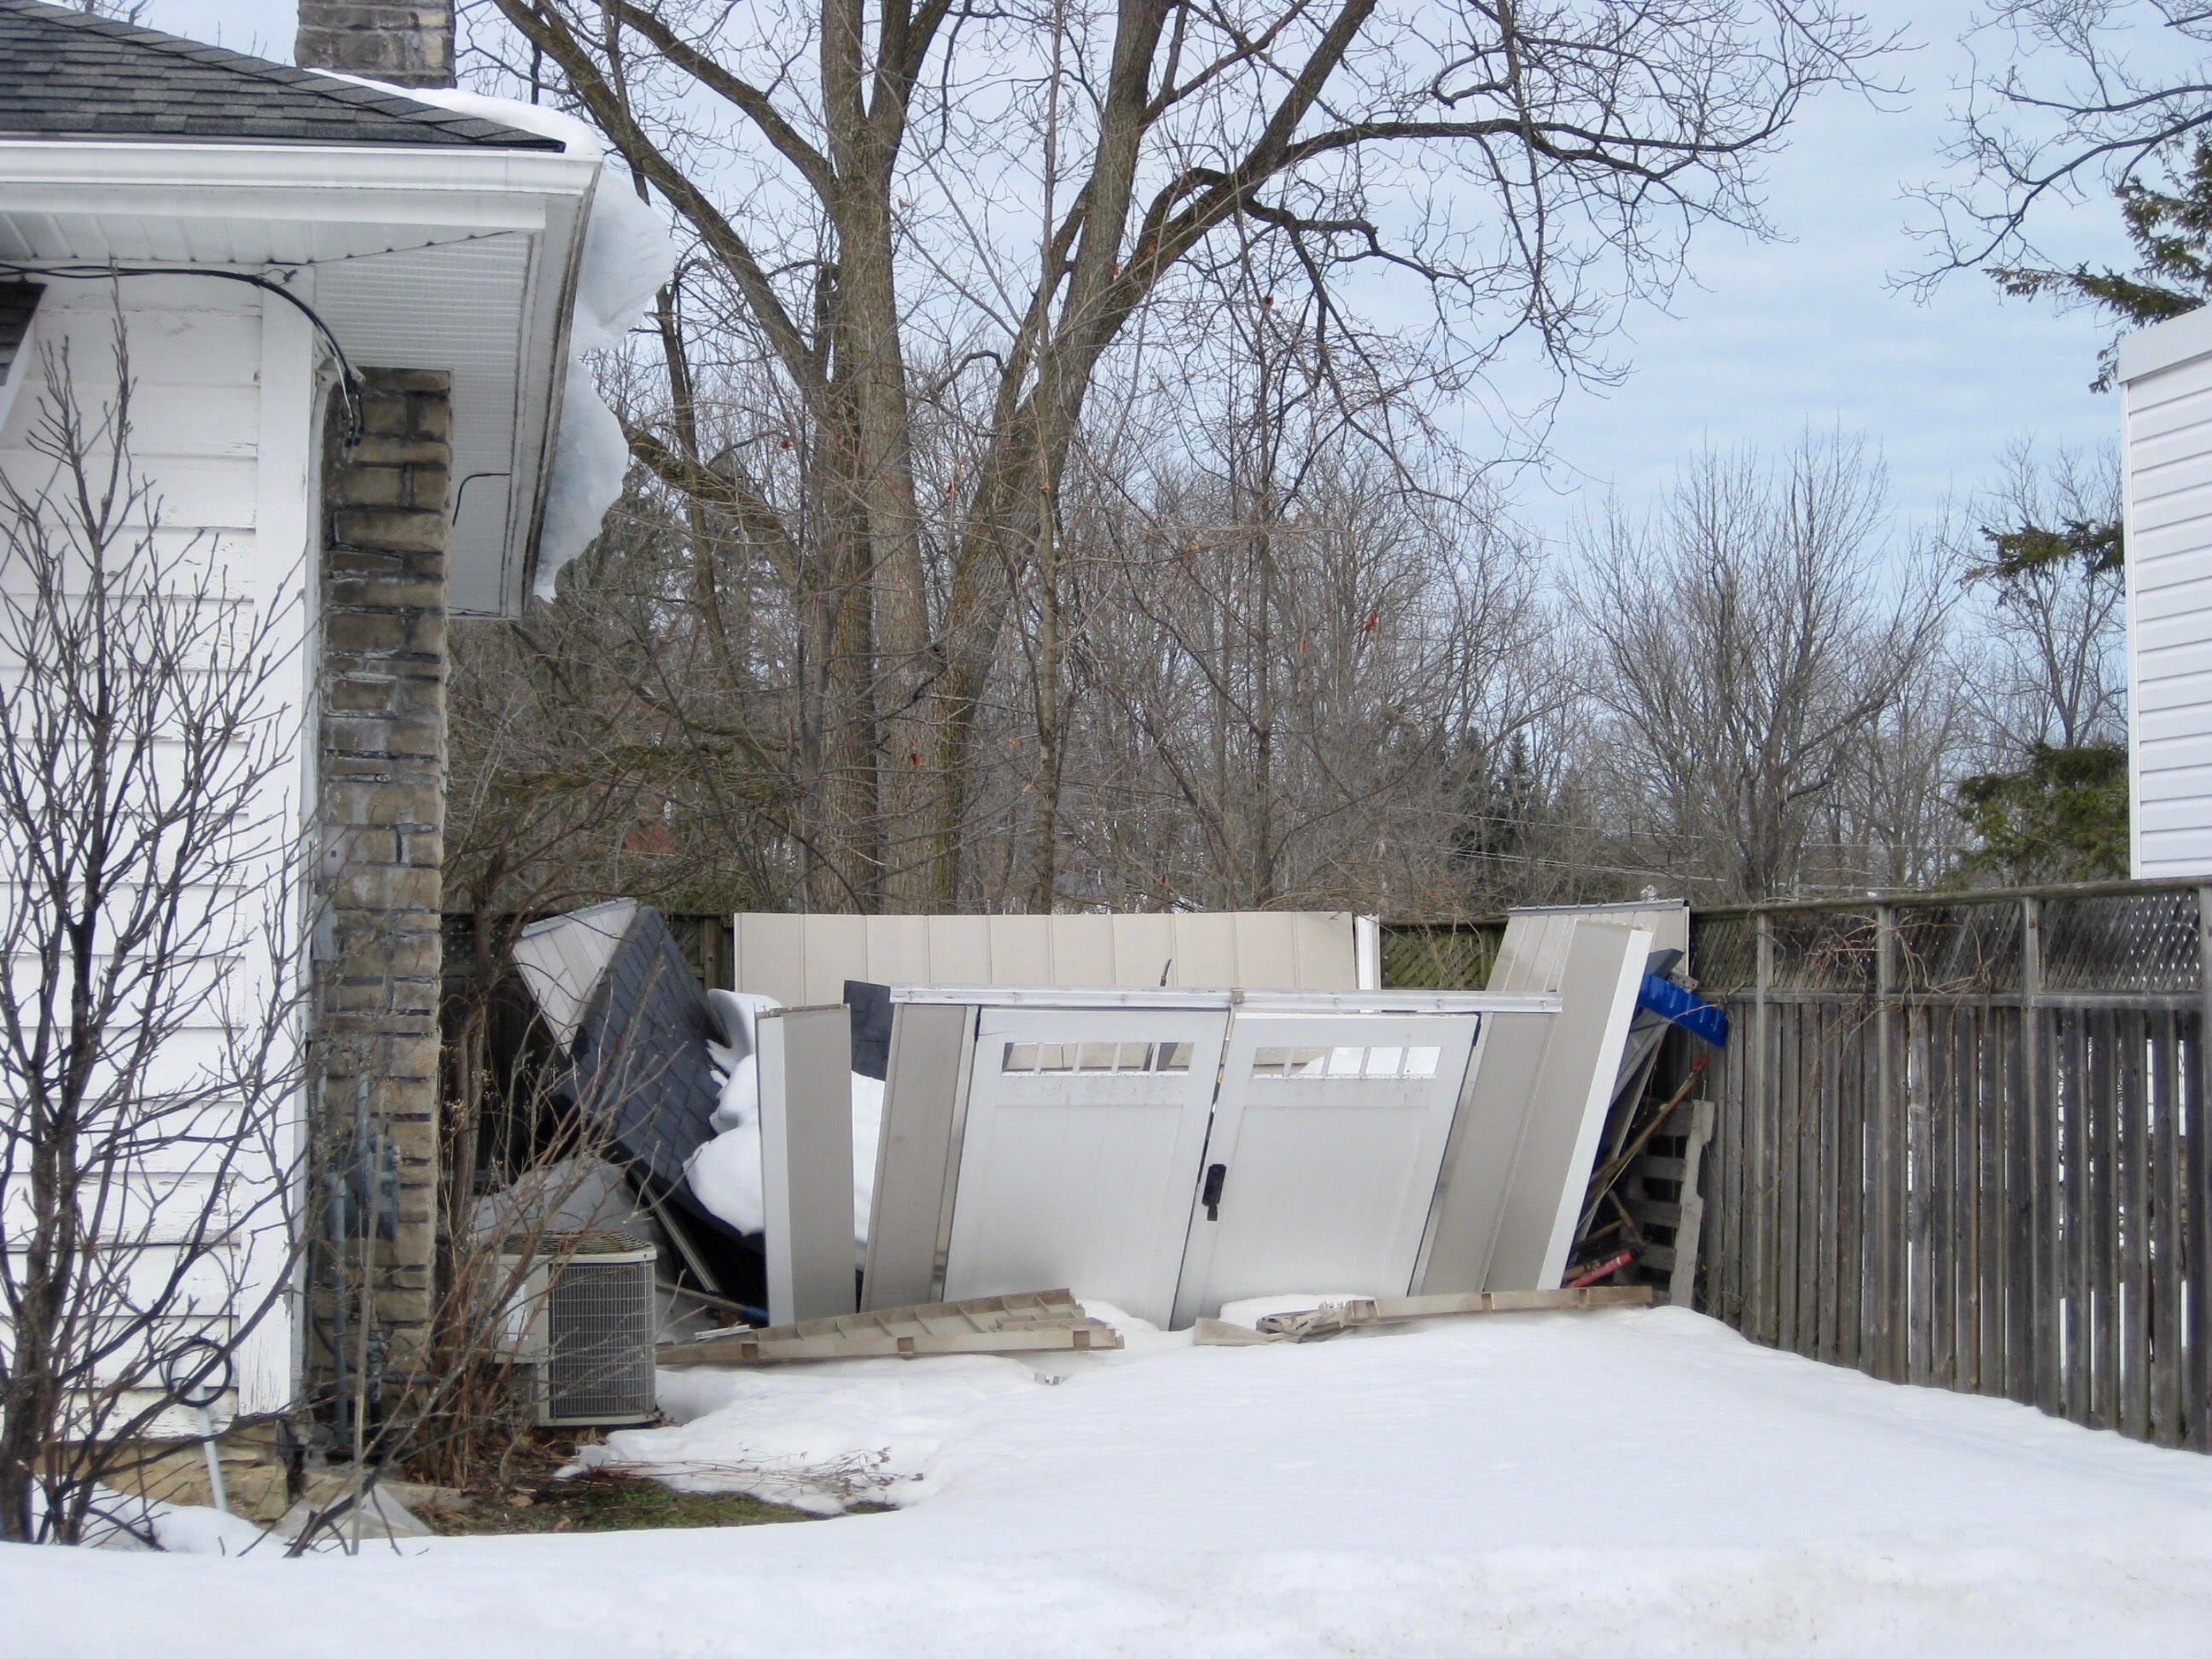
Many residents of Owen Sound have been looking at their houses and yards in dismay, wondering what happened. Based on our daily “downtown dog walk survey,” numerous houses exhibit damage from falling ice dams or snow loads. One neighbour noted that he hadn’t seen this much damage since 1984.
Gutters, sometimes including the entire fascia and soffits, can be seen hanging or lying on the ground, sheds lie crumpled, balcony railings have been taken out, and a neighbour’s power line was taken down in at least one case.
Based on a recent gutter installation on our garage, it’s safe to say that the damage could easily run into the millions.
What precipitated this situation?
Making sense of the local climate quickly becomes complicated when one considers the plethora of climatic factors that influence local weather patterns. These include global events such as El Niños/La Niñas, a potentially destabilizing polar vortex, living adjacent to a Great Lake, and climate change in general.
Combine this with the lack of a “January thaw,” and one can easily sympathize with the challenges that meteorologists face in making long-term forecasts.
Residents of Owen Sound are not unfamiliar with large snowfalls. The City recently reminded residents that the “average annual snowfall in Owen Sound is 330.4 cm (130.1 inches); the most in Ontario.”
While this statement has some veracity, it is not entirely correct. The 330.4 cm figure is the Environment Canada Climate Normal from 1981-2010 from the Owen Sound MOE Weather Station. Unfortunately, that station ceased operations in 2007, meaning that the 330.4 figure is approaching 20 years out of date and leaving Wiarton A as the nearest station for climate data.
Further complicating matters, the Weather Station in Wiarton received an average of 404.8 cm for the same period noted above, revealing that Wiarton, in fact, receives more snow than Owen Sound and that direct comparisons between the two stations are not simple.
Wiarton A has the longest time series available (1883 to 2025) and will, therefore, be used here.
Interestingly, the gap between the amount of snowfall in Wiarton over Owen Sound increased from 9% (1931-1960 Normals) to 18% for 1981-2010 normals.
In other words, in 1931, Wiarton received 27.2 cm more than Owen Sound, and by 2010, it received 79.4 cm more than Owen Sound. In fact, Wiarton A records more snowfall than any other station in Ontario.
Sault Ste. Marie receives the next greatest amount of snowfall at 324.9 cm, 60.2 cm less than Wiarton A.
Nationally, Wiarton A ranks 233rd out of 245 Weather Stations in terms of snowfall. With the exception of the Gaspe station in Quebec, all of the other stations receiving more snow are in either Newfoundland or British Columbia. The Pleasant Camp, BC station receives the most snow in Canada, averaging 666.9 cm per year.
So what about our winter here in Owen Sound?
Though not the largest local snowfall on record, at 441.4 cm the past winter of (October 2024 to March 2025) ranks as the 108th greatest snowfall of the 130 years on record. A closer examination of the data reveals that of the 21 winters with snowfalls greater than 400 cm, 16 or 76% have been since 1960. Despite the perception of this being an extreme event, there have been 4 winters with more snowfall since 2000.
It appears that in addition to living in an area prone to large snowfalls, the residents of Owen Sound were the victims of the confluence of 4 climatic factors that contributed to the structural damage.
A slowly-developing La Niña yielded wetter-than-average conditions for the Great Lakes region (National Oceanic and Atmospheric Administration (NOAA)).
The polar vortex remained over Canada, resulting in the Great Lakes being subjected to frigid weather and an active storm track delivering above-normal precipitation totals throughout the month (The Weather Network)
Ice cover on Lake Huron remained well below average. Between 1973 and 2023, ice cover has declined by 25 percent. “In addition, the length of the Great Lakes ice season has decreased by approximately 27 days on average over the same period” (NOAA). As a result, the potential exists for abundant evaporation of water from Lake Huron to feed the already wetter La Niña air and polar vortex-related storms.
There was no January thaw. There were only two days barely above 2° C, meaning that snow levels just continued to increase.
The chart below illustrates how a combination of above average snowfall, concentrated in a relatively short period, and the absence of a January thaw precipitated heavy snow loads on structures.
Was this past winter the result of climate change?
According to Environment Canada, the country “is warming at roughly double the global rate.” In 2009, scientists detected an increase in the average surface water temperature from 17.2 to 20.1°C in Lake Huron between 1968 and 2002. A preliminary analysis suggests that water temperatures have continued to increase since 2002.
Warmer waters lead to a reduction in ice coverage and duration, which in turn facilitates a ready supply of water to turn into snow.
As evidenced by the chart below, we can see that other than for 5 days in February 2025, the ice coverage on Lake Huron remained well below the long-term average.
Scientists at NOAA are currently looking into the extent to which climate change outbreaks in the mid-latitudes are more likely. According to NOAA scientist Amy Butler, “Disruptions of the polar vortex occur when the vortex is bumped from below by large-scale atmospheric waves flowing around the troposphere.”
So, in conclusion, it appears that a combination of global climate events, a possible shift in the polar vortex, and a changing climate contributed to the heavy snow loads in Owen Sound in 2025.
So how did the City of Owen Sound cope this past winter?
Now that we have a better understanding of what caused our recent winter weather, let’s explore how it was managed. To be fair, those who manage our roads and sidewalks need to learn and adapt as climate change precipitates more extreme events and variability in weather patterns.
Budgeting for an “average winter” can quickly become ineffective when events conspire to deliver relentless snowfalls.
As someone who walks downtown every day, I can attest to the frustration some have expressed regarding the perceived delays in removing the snow from sidewalks. In our neighbourhood, the sidewalks were not cleared until 1 ½ weeks after the roads. For those without vehicles, this necessitated walking on the road, which can, in turn, pose safety concerns.
With an aging population, the proportion of City residents over 65 years has increased by 10% since 1996. The City needs to explore alternatives for making sidewalks more pedestrian-friendly.
While some are quick to point fingers at the City for delays in clearing sidewalks, it is important to consider the facts.
Firstly, snow removal in the City is regulated by Ontario Regulation 239/02 (Minimum Maintenance Standards (MMS) For Municipal Highways) of the Municipal Act, including sidewalks. In addition, Owen Sound is characterized by steep hills that result in numerous dead-end streets that complicate the development of efficacious plow routes.
The City has published “Know our Plan for Snow,” which provides additional details regarding what residents can expect in terms of snow removal and maintenance.
For example:
“Sidewalks are plowed concurrent with the roadways, with the City's sidewalk plows.”
“While the City has similarly classified its sidewalks to the roadways, this has a less practical impact on prioritization. One reason is that the Minimum Maintenance Standards (MMS) does not designate different response times based on classification: the MMS requirement is that all sidewalks must be addressed within 48 hours of observing 8 cm or more of snow or ice formation. However, sidewalks on hills and those leading to schools (for example) have a high priority.”
“After a high-volume event, it can take significant time to clear the sidewalks because the sidewalk blower will only be able to travel at 2 to 3 km/h.”
Further:
The City has the same number of street (4) and sidewalk (4) plows.
There are 2.7 times more kilometres of roads than sidewalks, but street plows travel much faster than sidewalk plows.
The City has assigned priority to some areas (e.g. hills, near schools).
One can, therefore, expect to see differences in snow removal times. For example, Lara Widdifield, Director of Public Works and Engineering, recently noted that “With over 105 km of sidewalk, it can take an entire workweek to complete one cycle. Mix in back-to-back snowfalls and significant weather events, and there can be stretches of weeks where they never finish.”
The relentless snowfall in 2025 forced the City to repeatedly declare significant weather events. With over 112 cm of snow (1/3 of the quota for the entire year) between January 12th and 28th, it can be nigh on impossible for staff to keep up.
Under Ontario Regulation 239/02, the City can declare a Significant Weather Event. This places the timelines and criteria spelled out in the Minimum Maintenance Standards on hold until the event is declared over.
As noted in Know our Plan for Snow, “the event is usually declared over when staff find that roads are being brought back into good driving conditions and often in advance of sidewalks, which require more time. Staff also must be confident that sidewalks can be addressed within 48 hours before declaring the event over.”
The City is aware of public concerns. The Citizen Satisfaction Survey reported that winter sidewalk maintenance service levels were among the lowest-rated services. In response, Widdifield recently undertook a Winter Maintenance Review that identified 10 recommendations, including the need:
for updated traffic count data;
to review the level of service for sidewalk winter maintenance; and
to assess the sidewalk plowing program to determine if changes to the fleet units, routes, and satellite refill locations could improve efficiency and response times.
At the end of the day, the City has limited options for ensuring sidewalks are cleared in a more timely manner. They could:
require residents to clear sidewalks in front of their properties;
divert resources from road maintenance; or
increase its sidewalk clearing resources i.e. purchase more sidewalk plows and hire more staff.
Many municipalities across Canada have opted to require residents to clear sidewalks in front of their properties. For example:
Vancouver residents are expected to have their sidewalks cleaned for pedestrians by 10 a.m. daily;
Saskatoon gives its citizens 24 hours to get the job done;
Numerous other cities, including Edmonton, Windsor, Ont., Hamilton, Kitchener, Ont., and Waterloo, Ont., have also off-loaded responsibility for sidewalk shoveling onto residents (Macleans 17 MARCH 2011)
Diverting resources from roads is likely a non-starter due to safety and regulatory constraints and adding another sidewalk blower would cost $190,000 plus $30,000 to $90,000 for additional staff.
In conclusion, residents of Owen Sound can expect to experience more extreme events (rainfall, snowfall, winds) as the climate changes. It may be time to consider structural improvements to homes, such as Moore Vents, to improve ventilation to reduce ice build-up in the winter and extreme heat in the summer.
At the same time, Public Works and Engineering staff will be challenged to monitor and adapt to climate change and atypical weather events. And City Council will need to pivot as funding priorities shift to infrastructure designed to better handle things like large rain events.
Thank you to sponsors of The Owen Sound Current Writers’ Fund, who make these community contributions possible. Contributions from the community do not necessarily reflect the opinions or beliefs of The Owen Sound Current and its editor or publisher.
Good article and aptly timed...it's snowing now.