

Our Town: Owen Sound's Average Income Is $77,300. Most Residents Earn Far Less.
Statistics Canada data show 43% of Owen Sound residents earn under $30,000 after tax, and the income gap with neighbouring communities is growing, says David McLeish.

OUR TOWN | OPINION
Our Town is a limited series of columns by Owen Sound resident David McLeish. This column reflects the analysis and evidence-based opinions of the author and is part of an ongoing opinion series. It is not news reporting.
In my last Our Town column, we looked at who lives in Owen Sound, how old they are, and how dramatically that has shifted in a generation. Today, we’re exploring what residents actually earn, how that compares with neighbouring communities, and why the gap keeps widening.
The assessment of income in a community is not a simple task. The Census of Canada provides a host of measures such as “median,” “average,” “total,” and “after-tax income” in several categories including individuals, households, economic families. This can make it challenging to ‘pick’ a number.
For example, the Demographic Data provided on the City of Owen Sound’s webpage notes that the city’s average household income is $77,300.
This is a factual statement, sort of, derived from the 2021 Census. It is not the number per se, that is the issue; rather it is what it represents that can cause confusion. To understand the challenge we need to recall some basic statistics.
In this case, to calculate the average we first sum the incomes for all the households in Owen Sound and then divide that number by the number of households:
Sum of all incomes ÷ Number of households with income = Average
or
$764,885,245 ÷ 9,895 = $77,300
Firstly, the value provided by the City is actually called the “average total income of household.” This number is before taxes have been deducted. I don’t know about you, but I can’t spend money that the taxman has taken or will take from me. I can only spend my after-tax or disposable income.
The Average After-Tax Household Income in Owen Sound is $67,600. Note that this is almost $10,000 less than the average total income reported by the City. This number is also referred to as disposable income.
Secondly, the average or mean can be misleading. The problem with using the average lies in the fact that it masks some key information. As Statistics Canada notes:
“There are two drawbacks to using average income for analysis. First, since everyone’s income is counted, the mean is sensitive to extreme values: unusually high income values will have a large impact on the estimate of the mean income, while unusually low ones, i.e. highly negative values, will drive it down. Secondly, it does not give any insight into the allocation of income across members of the population.”
That last point is very important, as we will see.
Thirdly, when discussing income distribution, the median is a better option. Statistics Canada defines the median as:
“…the middle value in a dataset when all the data points are arranged in increasing order. This means that exactly 50% of the data points are less than or equal to the median, and the other 50% are greater than or equal to it.”
The Median After-Tax Household Income in Owen Sound is $57,600 — half make more, half make less. This value is $20,000 less than the figure reported by the City.
If you were thinking of opening a business in the city, I suggest that this number would be more important to you than the Average Before-Tax Income.
Finally, the value used by the City refers to a household, not an individual. Statistics Canada defines a household as “a person or group of persons who occupy the same dwelling and do not have a usual place of residence elsewhere in Canada or abroad.”
The average household size in Owen Sound is 2.1. We don’t know if the additional 1.1 persons are adults or children, but Statistics Canada does provide some helpful information that is relevant to this question.
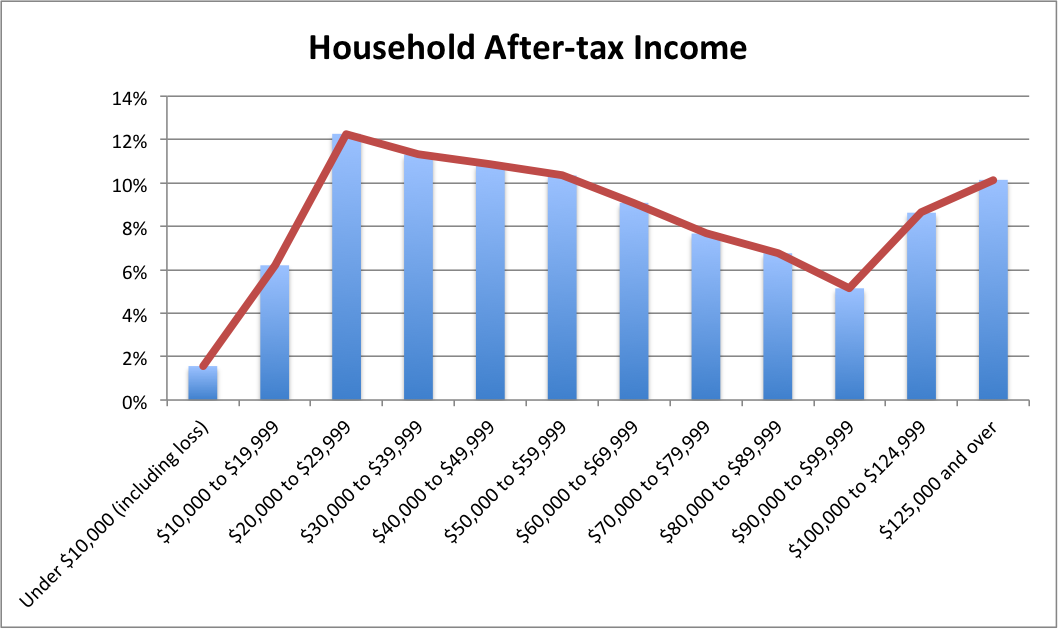
Here is the percentage distribution of household after-tax incomes for Owen Sound in the 12 income ranges used by Statistics Canada. It illustrates that the distribution of Household After-tax income is bi-modal, with the largest peak occurring at $20,000 to $29,999 and a second, smaller peak at $125,000 and over.
Of the 9,895 dwellings (i.e. houses, apartments, etc.) in Owen Sound in 2021:
3,780 were occupied by one person, and
1,285 were occupied by single parents with an average of 1.7 children.
This means that 5,065 households (34% of all households) rely on a single income. The Median After-tax Individual Income in Owen Sound is $33,600. Given that half earn less than this, many households are actually able to spend far less than $77,300.
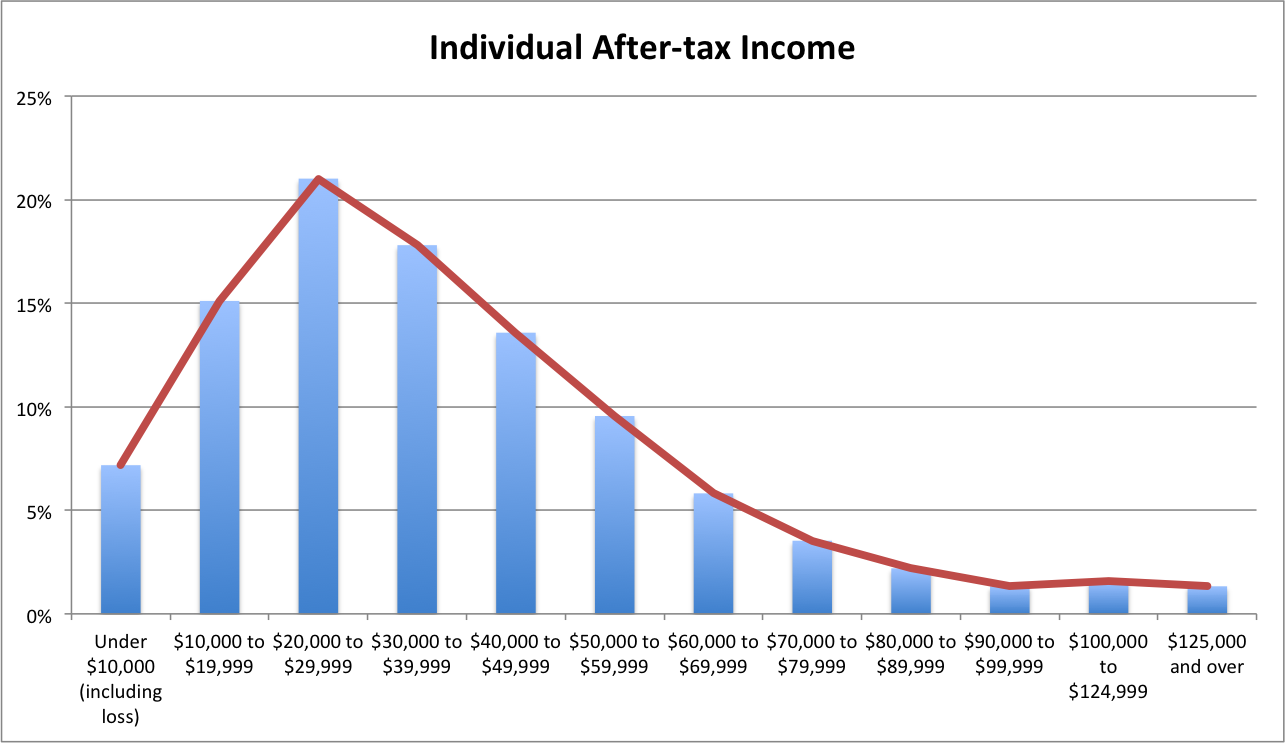
The graph below illustrates the distribution, by percent, of the Individual After-tax Income in the Statistics Canada’s 12 after-tax individual income categories.
Note that this population (17,285 individuals) does not include children and others who do not earn an income. As you can see, this distribution is highly asymmetrical or left-skewed with a large ‘hump’ on the left side. This graph illustrates that:
The mode, the value that appears most often, is between $20,000 and $29,999.
If we add up the number of people in the bars from the mode to the left, we discover that 43% of individuals in Owen Sound earn $29,999 or less.
If we include all individuals that fall under the ‘hump’ we learn that 14,550 individuals (84% of the total) earn $59,999 or less after-tax.
Lastly, only 10% of individuals earn $70,000 or over.
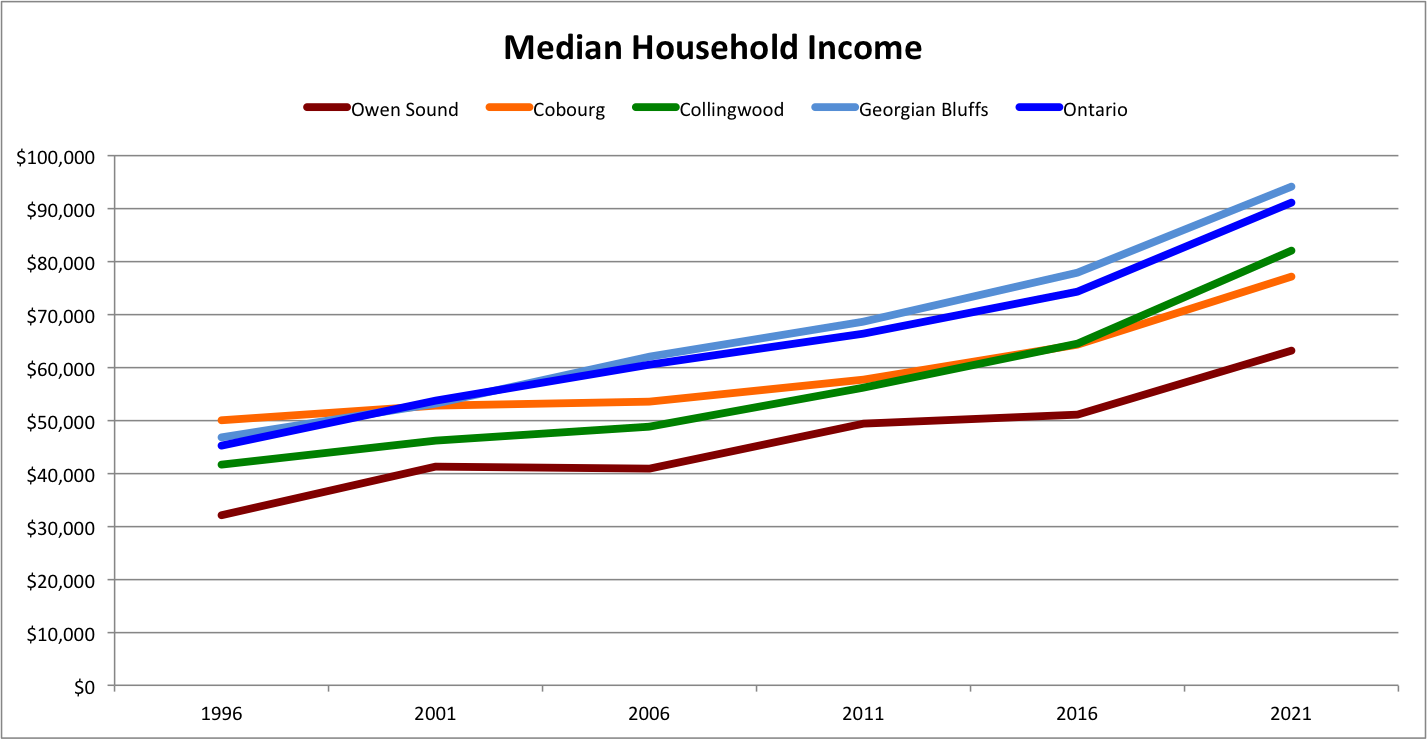
Relative to similarly sized communities and Ontario, Owen Sound is conspicuous by the extent to which incomes here are lower.
As can be seen in the chart below, the Median Household Income in Owen Sound has been lower than the other jurisdictions since at least 1996 — and that gap has been widening.
The next chart is based on the same data, but it illustrates the amount by which incomes in Owen Sound differ from the other places.
Each line represents the median household income in Owen Sound minus the other community (Cobourg, Collingwood, Georgian Bluffs, and Ontario).
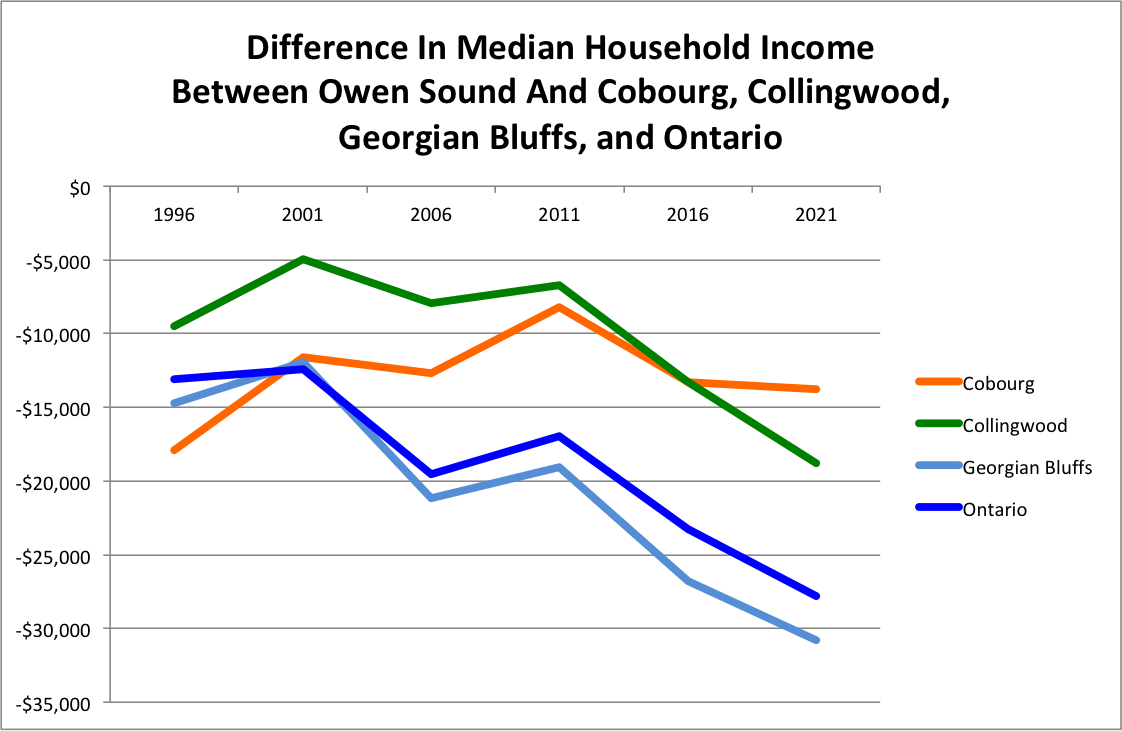
In general, with the exception of 2011, the gap between incomes in Owen Sound and the other locations has been widening since 2001. In 1996, the median income in Owen Sound was almost -$10,000 to -$18,000 less than the other locations and by 2021, the gap had increased to -$13,800 to -$30,800 per year.
As will be discussed later, of particular interest is the ranked order of the gaps. From the largest to the smallest: Georgian Bluffs > Ontario > Collingwood > Cobourg.
Thank you to sponsors of The Owen Sound Current Writers’ Fund, who make these community contributions possible. Contributions from the community do not necessarily reflect the opinions or beliefs of The Owen Sound Current and its editor or publisher.
See more in this series:
