

Our Town: Owen Sound Is Aging Faster Than Ontario or Canada
Manufacturing jobs fell from 2,500 to 790 since 1981 as health care grew. Owen Sound now holds more long-term care beds per capita than Toronto, says David McLeish.

OUR TOWN | OPINION
Our Town is a limited series of columns by Owen Sound resident David McLeish. This column reflects the analysis and evidence-based opinions of the author and is part of an ongoing opinion series. It is not news reporting.
In my last Our Town column, we examined some of the policies meant to protect Owen Sound’s downtown and why they haven’t. Today, we're turning to the people themselves — who lives in Owen Sound, how old they are, and how dramatically that has shifted in a generation.
The age distribution of the city’s population is particularly important as a healthy age structure ensures adequate replacement as elders age out and to assess the strength of the workforce for employers. The distribution of ages is also valuable in that it can help us predict a future state.
Census Canada conducts surveys every five years, and Statistics Canada publishes the age composition of the population at various scales in 5-year age increments (i.e. 0 to 4 years, 5 to 9, 10 to 14, etc.). These data can be used to assess a population, whether it is growing, stable, or declining.
The age structure also reveals whether the population is made up of equal numbers of young, middle-aged, and old or whether it comprised primarily of a particular age group.
In general, a population is considered to be growing when there is a large proportion of young and reproductive-age individuals. In this case, a plot of the age distribution takes the shape of a pyramid, with large numbers of young people at the bottom and diminishing numbers of older individuals towards the top.
In contrast, a population that is in decline has a large proportion of post-reproductive-age individuals. It is shaped more like a beehive with a bulge in the middle and narrow at the bottom and top.
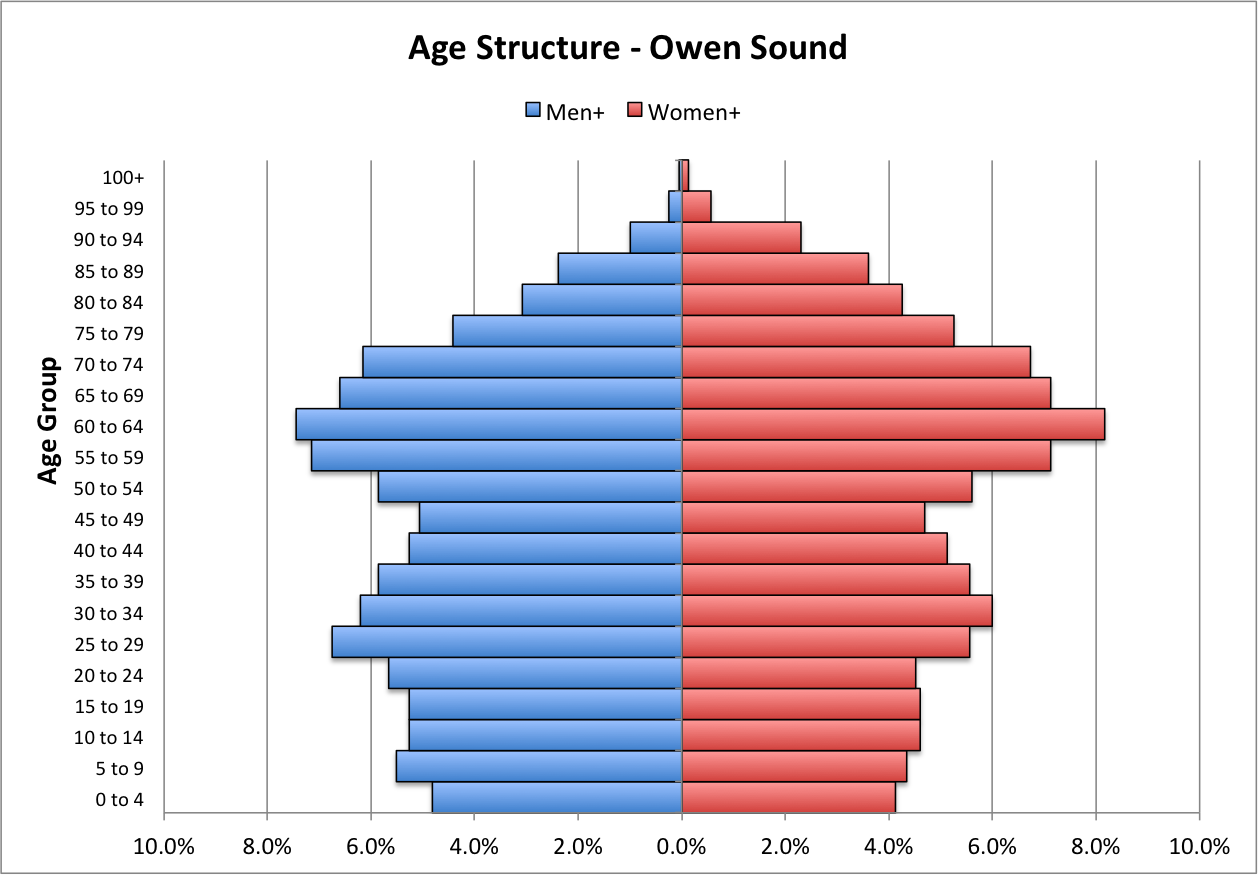
[Note, Statistics Canada qualifies their data as follows: “Given that the non-binary population is small, data aggregation to a two-category gender variable is sometimes necessary to protect the confidentiality of responses provided. In these cases, individuals in the category “non-binary persons” are distributed into the other two gender categories and are denoted by the “+” symbol. The category “Men+” includes men (and/or boys), as well as some non-binary persons. The category “Women+” includes women (and/or girls), as well as some non-binary persons.”]
The chart below illustrates the age distribution for Owen Sound in 2021. As can be seen, it is shaped somewhat like a beehive. Individuals aged 55 to 74 constitute the largest group (28%) with those aged 25 to 44 year age group comprising the second largest category (23%).
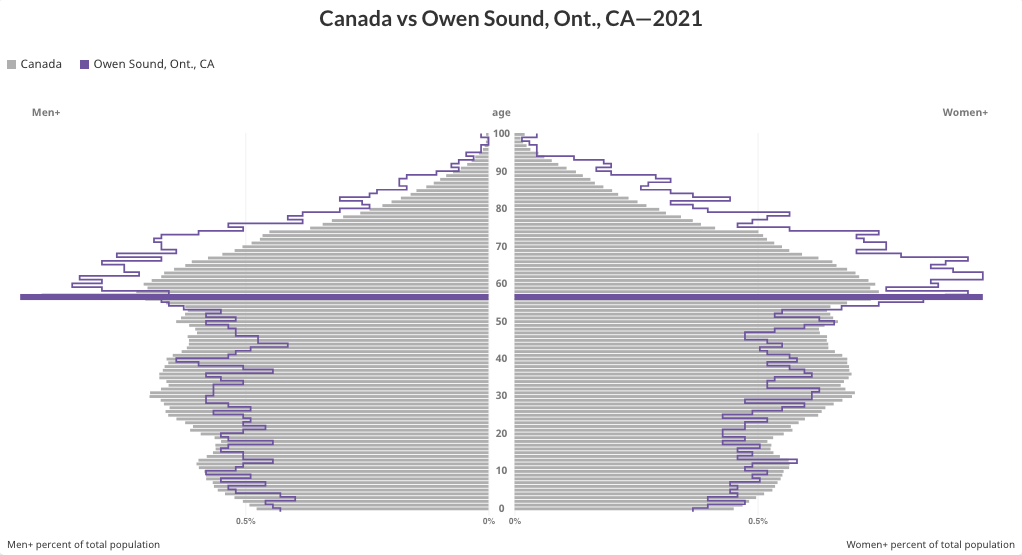
By way of comparison, Canada is also getting older and it too is characterized by a beehive shape.
As can be seen from the plot below, relative to the country, Owen Sound’s age distribution is skewed even more towards older individuals and considerably fewer individuals under about 58 years. A comparison of Ontario and Owen Sound yielded a similar result.
In addition to having a relatively older population than Ontario or Canada, Owen Sound is getting older, faster.
In 1991, the median age (half are younger, half are older) for City residents was 38.2 years, 3 years older than either Ontario or Canada. By 2021, the median age here was 48 years, an increase of 10 years. In contrast, it had only increased to 41.6 in Ontario and Canada.
In other words, over a period of 30 years, the median age in Owen Sound increased by 10 years whereas both Ontario and Canada only increased by 6.4 years.
Essentially, the City is skewed towards older adults with only limited recruitment of younger individuals. Enrolment in area schools provides a rough index of recruitment (i.e. younger individuals arriving to replace older ones).
Between 2008 and 2015, the combined enrolment of the two major school boards in the area declined from 22,983 to 19,994, a 13% drop. Although it has since rebounded to 24,089 in 2025, that only represents a 4.8% increase over 2008.
As noted above, Statistics Canada provides age distribution data in 5-year increments. These data can be plotted to illustrate the shape of the City’s age structure every 5 years from 1996 to 2021. Immigration and emigration also need to be considered in the interpretation of these data though there is limited evidence of immigration.
The following plot compares the age structure of the City’s population in 1996 and 2021:
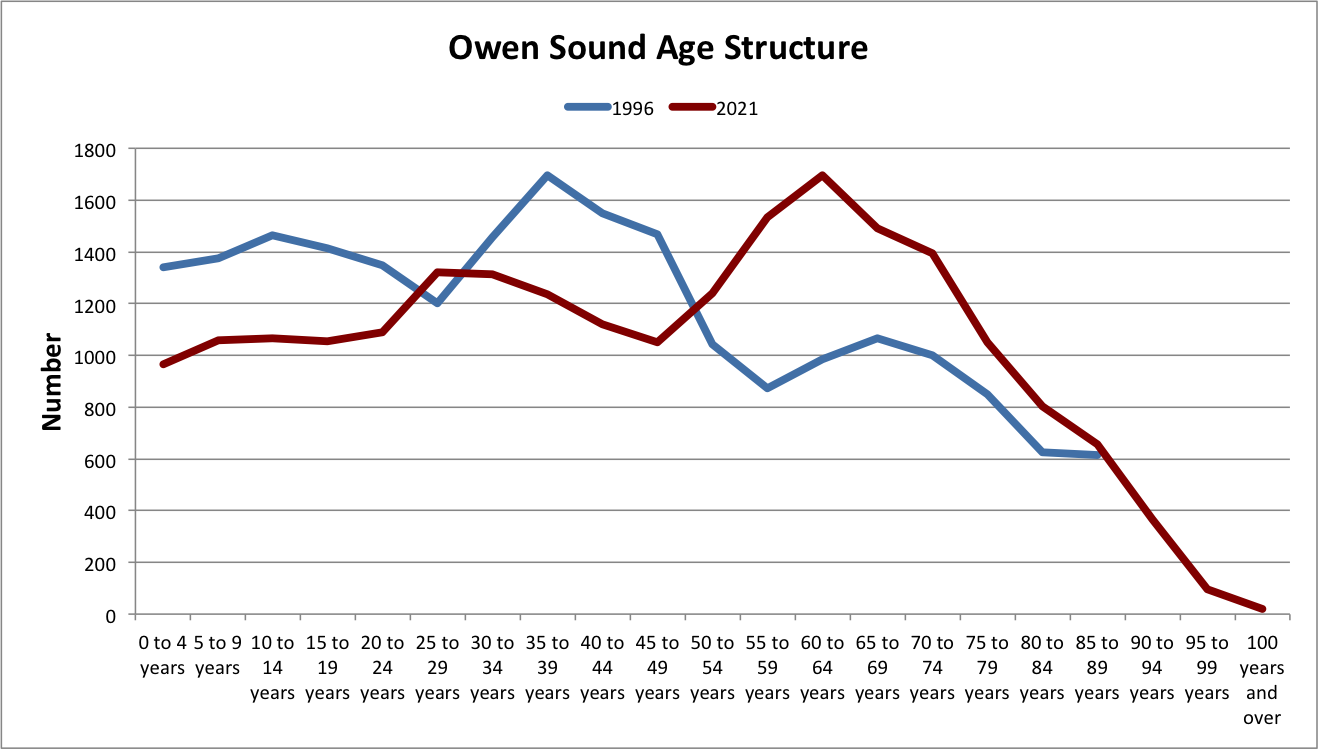
(Prior to 2016 Statistics Canada’s oldest age category was 85 years and over. The final point on the 1996 (blue) line is therefore 85 years and over whereas the 2021 line includes 3 more categories.)
This plot reveals a great deal about the City’s demographics:
The distribution of ages, as illustrated by the shape of the two lines, has remained very similar over 25 years.
The large ‘hump’ on both lines has remained intact. It represents the “Baby Boomers” (born from 1946 to 1964). This group appears as 35 to 49 year olds in 1996 and then 25 years later as 60 to 74 year olds in 2021.
The smaller ‘hump’ on the left on both lines represents both “Generation X (Gen X)” (born from 1965 to 1980) and mostly “Millennials (Gen Y)” (born from 1981 to 1996). This group is represented by 5 to 19 year olds in 1996 and then 25 years later as 25 to 40 year olds in 2021.
The aging of the Baby Boomers coupled with the decline in abundance of those under 25 years has affected 30% of the population of the City. Over the 25 years from 1996 to 2021, the number of people younger than 50 years has decreased by 3,160 and the number of people 50 years and older has increased by 3,285.
We can see how these changes have affected each age category. If we subtract the number of residents in each age category in 1996 from the same age category in 2021 we can see the age groups where the population has changed.
If there were no changes the result of the subtraction would be zero (i.e. the number was the same in each year) and the line would be flat.
Alternatively, if the number of people in an age group became smaller from 1996 to 2021, the number will be negative.
If the number of people in an age group became larger from 1996 to 2021, the number will be positive.
The plot below illustrates how the age composition of the City changed between 1996 and 2021.
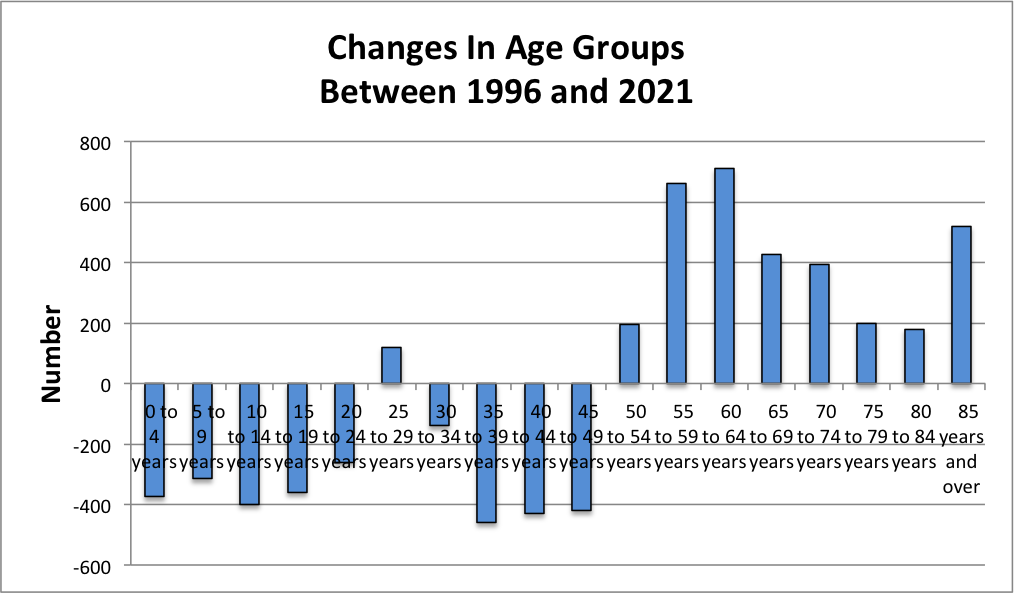
The number of residents in almost every age category under 50 years of age diminished in size whereas every age category over 50 years of age increased in size. Note how the shape of the bars over 50 years is very similar to the Baby Boomers in the plot above.
If we add up the negative numbers we discover that the number of residents under 50 years declined by 3,160 people or (15% of the population). Similarly, if we add up the positive numbers we can see that the number of residents over 50 years increased by 3,285 people or (15% of the population). Although these changes occurred over 25 years, this would be akin to loading 58 motor coaches with City residents under 50 years of age, taking them to the GTA, and then bringing the buses back full of people over 50 years.
Demographics & Occupation
As noted previously, Owen Sound has been home to numerous businesses over the years. Many have since ceased operations but a few remain in business. New companies have started, but the jobs are often different.
The number of people employed in the City over the past 40 years has remained relatively constant, deviating from the mean by no more than 6%.
Since 1981, the number employed in the City has averaged 10,192, peaking at 10,780 in 2006, then declining to 9,785 in 2021. Interestingly, the number in 2021 was virtually identical to the mean of the 1980s.
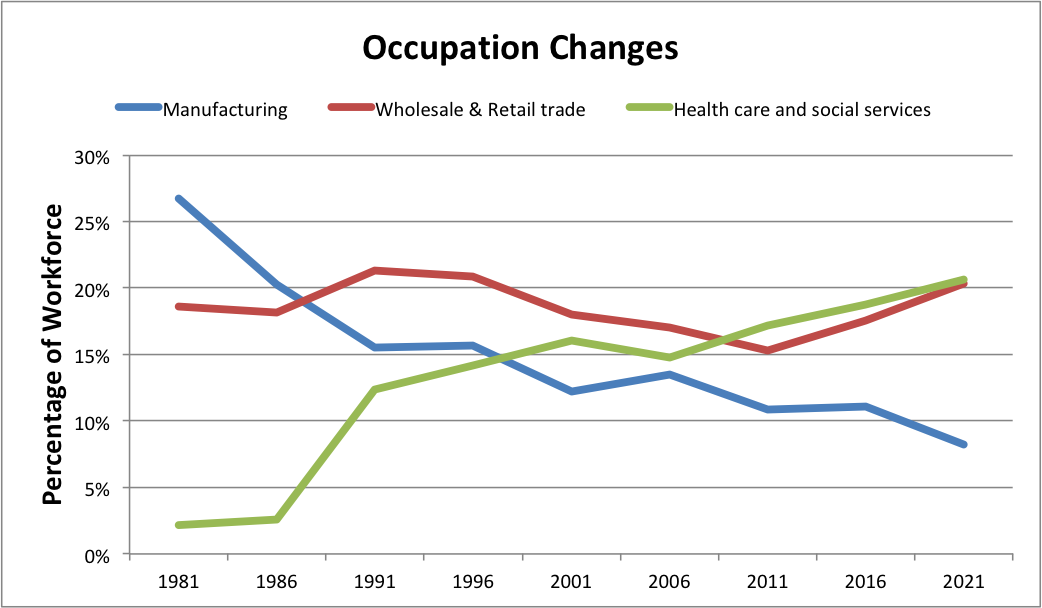
Even more interesting have been the changes in occupation. Of the 20 or so categories employed by Statistics Canada, three —Manufacturing, Retail, Health & Social Services — have regularly comprised about 50% of the City’s workforce. The other 17 or so categories making up the remaining 50%.
The only other category with a sizeable number of workers was Construction, which comprised 10% of the workforce in 2021.
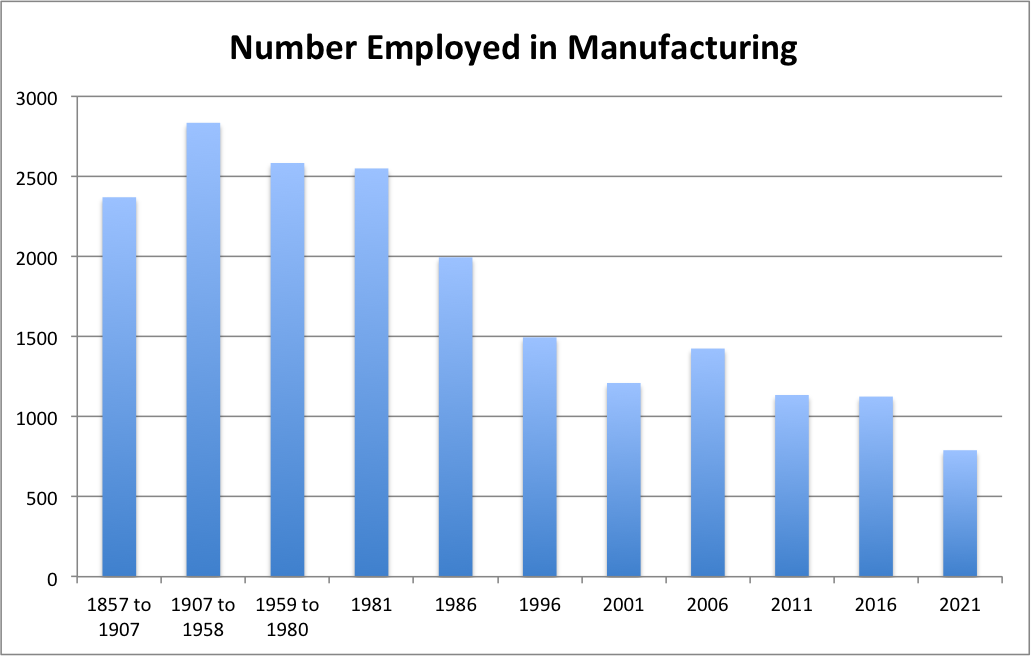
Of particular note has been the substantial decline in employment in the manufacturing industry. While statistics on the number of workers were not collected regularly until the 1980s, a variety of historical reports provide reasonable insights as to the size of the manufacturing workforce over the last century.
As can be seen in the chart below, about 2,500 people were regularly employed in manufacturing from 1857 to about 1981; however, that number dropped sharply to the point that only 790 were employed in manufacturing in 2021. This is consistent with the loss of several large companies as noted above.
Inversely related to the declines in the manufacturing sector has been an increase in employment in the health and social services sector. In 1981 and 1986, the average number of workers in this sector was just under 1,000. By 2001, that number had risen to 1,580 and in 2021 it reached 1980.
Despite the growth in the number of retail businesses in the uptown areas, the proportion of people employed in this sector has remained relatively constant.
The increase in the number of jobs in the health care sector reflects several factors. For example, the opening of the Grey Bruce Regional Health Centre (now part of Brightshores Health System) on June 26, 1986 is coincident with the subsequent addition of 710 more healthcare jobs in the City.
Other explanations include the fact that Owen Sound offers more medical specialists than outlying areas, the presence of 3 Long-Term Care facilities (429 beds), and 9 retirement homes (696 units), some opening as recently as 1998, 2012, 2013, and 2022.
Taken together, an estimate of 1,500 residents of Long-Term Care facilities and Retirement Homes is likely not far off.
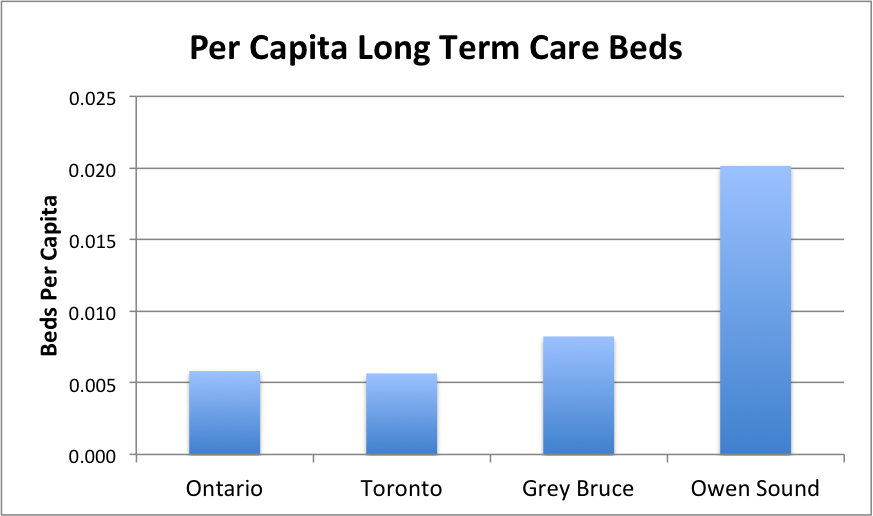
As the ‘Long-Term Care (LTC) capital of Ontario’ (my moniker), Owen Sound has more beds per capita than Toronto, Grey County, and the Province.
Currently sitting at 429 LTC beds, there is no shortage of demand. There are currently 548 people on the waiting list for the facilities in Owen Sound alone.
In other words, if every current occupant won the lottery and moved to the French Polynesian Islands, there still would not be enough beds to accommodate everyone.
It should also be noted that in 2021 the “Baby Boomers” were 57 to 75 years old and had only just started to enter retirement homes. In other words, the demand for LTC beds can be expected to increase over the next 20 plus years.
Stay tuned for the next in our series, when we’ll take a look at another facet of Owen Sound’s demographics — how income levels have trended.
Thank you to sponsors of The Owen Sound Current Writers’ Fund, who make these community contributions possible. Contributions from the community do not necessarily reflect the opinions or beliefs of The Owen Sound Current and its editor or publisher.
See more in this series:
